The markets had about a 10% correction that started last month. We normally have a 10% correction about once a year, and two to three 5% pullbacks each year. We’ve been fortunate to have not had a 10% correction for almost two years. If you’re a new investor, the correction may have been a shock.
Below are the main reasons for the correction:
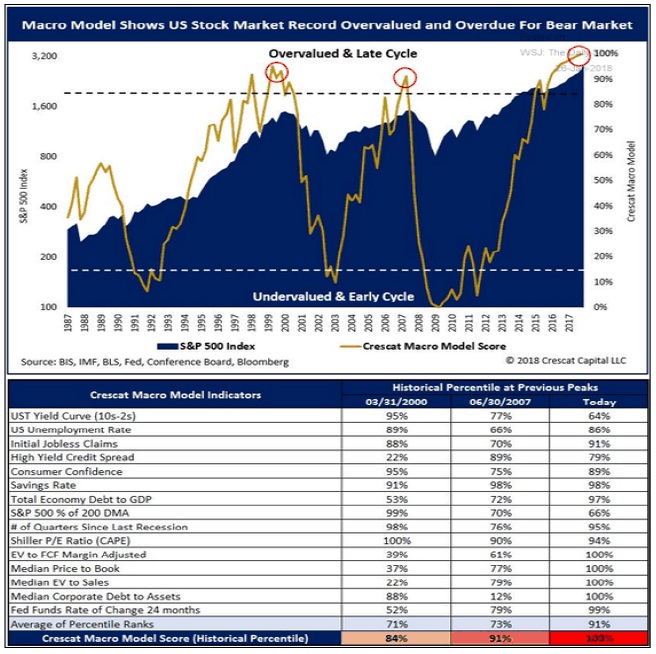
- Markets were overvalued by many metrics including: price to sales, P/Es, adjusted earnings yield, dividend yield, discounted cash flow values….
Source: @TaviCosta
The chart and table also point out that we are late in this market cycle.
- Markets were overbought

Source: www.erlangerchartroom.com
Prices accelerated from the long-term trendline, black line, and have fanned 3 times (dotted trendlines). It is normal for prices to pull back to the trendline once the third and second fan trendline is broken on the downside. Prices did pullback to the trendline.
- Rising wages, housing, and oil prices will put upward pressure on inflation. Inflation could cause interest rates to rise faster than the markets and economy can handle.
- The 10-year yield breached an important resistance level:

Some investors and analysts became concerned when the 10-year treasury moved above 2.6%, a long-term resistance level.
Low inflation, oil prices, and interest rates are good and stimulative to the economy. Rising inflation, interest rates, and oil prices are headwinds to the economy and markets.
Historically, the 10-year normally reflects inflation plus a premium of about 2% to 4%. This means the 10-year should be about 5% (2% inflation plus 3% premium). Investors must realize that as the Fed tries to normalize rates, the 10-year could climb from the current 2.9% to about 5%. Also, the Fed is expected to raise rates about 3 times this year. The market was not ready for these changes.
- The above causes started the correction, but it was derivatives that accelerated the downturn and caused the two days where the Dow 30 was down over 1,000 points each day.
Derivatives have caused dramatic falls in the markets in 1987, 1994, 1998, 2008, and now 2018. Investors and Wall Street have not learned from how dangerous some derivatives are (not all derivatives are dangerous).

In 1998, hedge fund Long-Term Capital Management used illiquid derivatives to make global bets based on quantitative models. Russian’s defaulted on their debt that caused massive losses creating a global financial crisis. Central banks provided massive liquidity to save the global financial system.

Some of these market corrections caused by derivatives are market events and don’t spill over into the economy and we don’t go into recession.
The market crash of 2008 was basically caused by highly leveraged CMOs, CDOs (Collateralized Mortgage, Debt Obligations) and the popping of the real estate bubble. Both caused the Great Recession.
This year’s correction was accelerated by VIX derivatives. Professional and individual investors and traders were trading VIX futures to make money and to protect against market swings. When the markets started selling off investors and traders to minimize losses either bought back those futures (causing VIX to spike more) and or sold stocks to minimize losses and the selling overwhelmed the markets. Below are the derivatives that caused the problems:

As the table shows, the inverse, short VIX ETPs lost most of their values. Both indexes values were about $3 billion before the correction.
Will Wall Street, investors and traders ever learn how leveraged, illiquid and financially dangerous some of these derivatives are.
- Fear and greed. Traditional economic classes teach us that participants in the economy make “rational” decisions. There has been a new discipline, behavioral finance (BH) that provides another explanation for economic and investment activity and decision making. BH combines biology, economics and investing. Below is a current chart of the market, and below the chart is the BH analysis.

Notice that the market was about 24,000 in late November, early December, and the market peaked around late January at about 26,600. It took about 2 months to make the climb. BH teaches that when prices are rising, dopamine (also known as a gambler’s high) is released into the brain.
What the market made in 2 months’ time is lost in about a week’s time. When participants lose money, cortisol (a flight or fight hormone) is released. Participants flee, sell irrationally. People losing money and cortisol are more powerful than making money and dopamine.
I will issue my monthly market update probably early next week, and I will provide my market targets based on fundamentals. I will also include technical/price analysis that could provide clues what we can expect from the markets in the short to medium-term.