It’s always important to understand the major bullish and bearish cases for the markets. I’ve listed both below:
• The new administration is pro-business, pro-growth. Many of President Trump’s advisors and cabinet members have impressive backgrounds with success in business and on Wall Street.
• Pro-growth policies will probably be enacted and include: lower individual taxes, lower corporate taxes, repatriation of trillions of corporate profits overseas, infrastructure and military spending, deregulation.
• Wall Street and many investors and traders are enthusiastic about the new direction and tone of the new administration.
• Some of the Corporate America’s repatriated capital could be used for stock buy-backs, increased dividends, and mergers and acquisitions.
• There is less supply of listed stocks. Less supply normally equals higher prices.
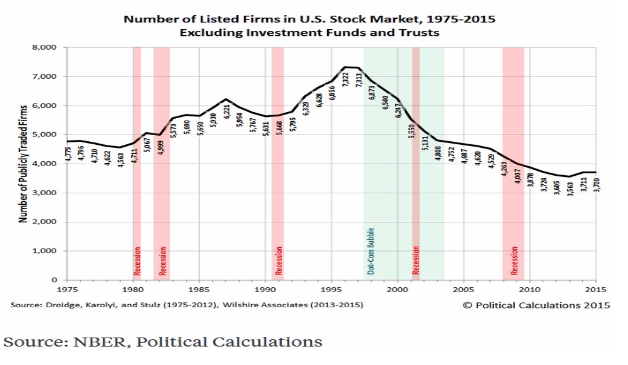
The number of listed companies in U.S. markets was 7,322 in 1995. Currently the number is around 3,700, a dramatic decline in the supply of listed firms in the U.S. equity markets.
Where have the companies gone: mergers and acquisitions, buyouts by private equity, bankruptcies (especially during the dot-com bubble), and some have gone private.
• We are finally moving from an economy that is stimulated by monetary policies (interest rates, quantitative easing, and a focus on the money supply) to fiscal policies (government spending and tax policies). The market was nervous that this could not happen without disruptions to the markets.
• Consumer and business sentiment indicators are very high. This should lead to increased demand.
• Valuations are expensive according to several valuation metrics. More on this below in the fundamental, valuation section.
• We are very late in this economic and market cycle.
• The U.S. has been in a “new normal” of slow growth as explained in Dr. El-Erian’s 2007 book, When Markets Collide. I wrote an update on the “New Normal”; click here to study the report.
• President Trump’s goal of GDP growth of 4% to 6% of sustained economic growth is unrealistic, especially this late in the economic cycle. Again, study Dr. El-Erain’s book or my update on the “new normal”.
• Interest rates, oil, inflation and the dollar are all rising. This could be disruptive to the economy and markets.
• He is losing credibility among his non-supporters domestically and internationally with many of his statements that are not based in facts. I listed some of them in my 2017 Economic Outlook. There are several websites that list his many misstatements and lies.
• Most of President Trump’s economic policies at this point seem to favor manufacturing and his base of supporters. The focus, at this point, aren’t economic policies that benefit all sectors of the economy and citizens of the U.S. This may result in continued sub-par economic growth.
• One of the big problems of the past administration and this administration are policies that don’t stimulate aggregate demand. The new administration’s policies are stuck in supply side economics (lowering taxes), and it’s proven that these policies don’t work as advertised.
• A slow growth global economy.
• Most of the major global economies (U.S. Europe, China, Japan) have too much debt.
• My 2017 Economic Outlook explained the many risks China faces including a potential trade war with the U.S., a slowing economy, exploding debt and poor capital allocation that mostly went to state owned enterprises, the government and real estate.
• Geopolitical hotspots including: the refugee crisis in Europe, terrorist attacks around the world, Syria, Iran, Iraq, North Korea, Ukraine….
• Some of President Trump’s policies, and comments are creating social conflicts, and could get in the way of his main focus - create more high paying jobs for U.S. citizens.
• There are also the black and grey swans that are unknown, unlikely, but if they happen would have a large, disruptive impact on global economies and markets. This could include: military and trade wars, weather disasters, banking crisis in Europe and China….
Curiously, many investors and traders are overlooking many of the risks listed above and are only looking at the potential stimulative proposals listed in the bullish case section.
Below is a chart of this market cycle:

Let’s review the chart:
• The market is up about 300% from the market cycle low that was made in March 2009. The market reflects the growth in earnings (the Fed’s ultra-low interest rate policy also helped). Prices also reflect the stagnant earning in 2015 and 2016, as prices have been going sideways from 2014 to most of 2016.
My strategy for subscribers, clients, and myself has been to buy during the basing phase of a bear market, and when values are inexpensive. I recommended taking profits on those positions as the cycle is maturing. More importantly take profits when valuations are expensive, and raise cash to take advantage of the next cycle. Hopefully, you bought near the bottom of the cycle and are starting to take profits and raise cash to take advantage of the next cycle.
I do recommend keeping some dividend paying stocks that were recommended many years ago. These stocks consistently raise their dividends, and were recommended at low valuations, and I doubt we would be able to invest at the prices recommended back then.
With the prices that I recommended, and the increased dividends, the dividend yields are above 7%. Occasionally options writing has brought down our cost basis, and the yield is even better than 7% if the subscriber, client did not spend their option premiums.
Currently I’m focusing on investing in companies that are in bear markets and that pay consistent, growing dividends.
• Prices did break out in the middle of last year, but it was not convincing. The break out was associated with negative interest rates at a few important economies around the world. Foreign capital was attracted to U.S. equity and debt markets where growth and interest rates provided potentially better returns.
Most breakouts have several conditions (also called filter) associated with a breakout:
1. A percentage break out of at least 3% to 5%. This breakout was below 3%, not convincing.
2. Closing at highs - True break outs are associated with closings at the high, or with white candles closing at high. The break-out had several dojis (closings in the mid-range of a candle).
Dojis are basically a fight between the bulls and bears, and is not a sign of a bullish trend.
3. Volume (essentially money, capital) must be significant to sustain a trend. Although not shown, volume was not enough to keep the rally going.
4. Time, the break-out is normally associated with several days of large white candles with closes at the high. This did not happen.
Notice how the rally did roll over. The filters did anticipate this.
The Trump rally that started after the election did have a stronger rally with large white candles, and met most of the breakout conditions
Let’s take a closer look at the Trump rally breakout:
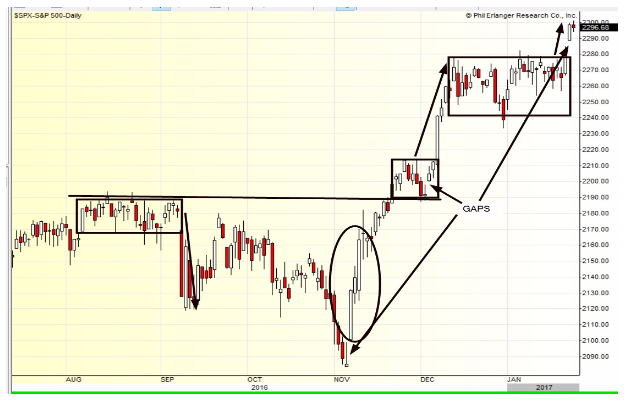
Let’s review this chart:
• The market had strong resistance at the 2190 area.
• In August, prices developed a short-term rectangle formation, normally a pause in the dominant trend (the dominant trend at that point was the topping of the market that started in 2014). As anticipated, the market did pull back to its support area of its trading range.
• The day after the election the markets had a significant rally with a gap and three big white candles with significant volume. The move was not the official breakout.
The market finally broke out of the resistance area of 2190 toward the later part of November. The breakout was not that impressive.
• In late November, early December the market made a flag formation (a very short-term formation that is a pause in a trend). There was another gap in this formation. By early December the rally resumed with several white candles, a stronger case for the breakout.
• For much of November and December, the market established another rectangle formation, a pause in a trend. Notice the trading range of the formation was basically tight suggesting that there were very little selling, and that the rally would probably continue.
• Prices did break out, but it was a tepid breakout and did not meet the filters for a true breakout. The second day is evidence with a doji, meaning a fight between the bulls and bears, and probably not a bullish breakout.
• Even though the rally and breakout was powerful, the upward 90 degree move is a sign of speculation, and many times these speculative 90 degree moves are easy to reverse. The trend is easy to reverse as speculators and traders are just as willing to sell (take profits) versus buy.
• Whenever there is an election with a major change in direction, especially economic policies creates both disruptions to markets and economies. I’ve been watching the markets and these transitions for decades. This is the most dramatic change I’ve witnessed. Some of the changes are needed and some will cause social, economic and market chaos.
I highlighted the gaps for several reasons. Normally gaps show a strong move. And most strong moves will have 3 to 5 gaps. There are three gaps in the Trump rally, meaning that this rally is close to running its course.
If earnings beat expectations, then the rally may continue. Once earnings season is over, it is normal for the markets to trade sideways after earnings season.
Or, if President Trump continues to battle and insult domestic and foreign friends and foes, these tensions could be reflected in the markets.
The above is an analysis of price, also known as technical analysis. If you would like to learn about technical analysis and use it as part of your investing and trading discipline, click here to take a free technical analysis course that I co-wrote. You may get some spam, but you should be able to unsubscribe.
Below is my current 2017 forecast for the markets:

The earnings estimates for the DJIA bottomed at 1201 before the election, and they have been revised upward to 1210 as of last week, only a .7% increase. The DJIA has climbed about 10% post-election, more than reflecting better earnings estimates for 2017.
Earnings are expected to grow about 6% to 10% for 2017 (I do expect the higher growth number to be revised downward). Earnings growth in 2016 was basically flat but the market had a total return (appreciation and dividends) of about 14%. It is very possible that the market anticipated better earnings in 2017, and the many stimulative economic policies that may be implemented.
The 2016 market returns have probably borrowed from 2017’s potential.
If earnings can be met, then prices can grow into its valuations and markets can move sideways. If not, then earnings multiples could contract and the market could correct.
Analysts and economists are waiting to see what will be passed and when, and also confirming that there will be no trade wars. Investors and traders are not waiting. I am with analysts and economists.
I included two forecasts, one using a realistic P/E that adjusts for the many external and domestic risks the economy and market faces, and the second forecast is with a higher, riskier P/E. The market is overvalued using the lower P/E, and is fairly using a higher P/E.
Below is a history of the P/E since 1990:
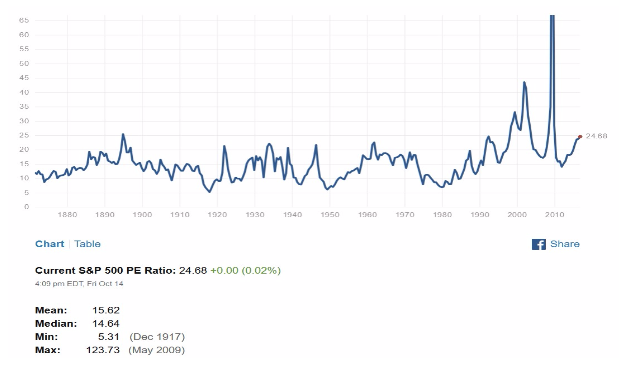
According to the chart, the current P/E is historically high indicating that the market is overvalued.
Below is a chart that shows the historical returns with different P/E levels:
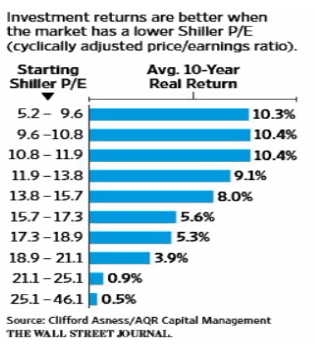
As the chart above shows, it is better to invest when P/Es are low and avoid stocks when P/Es are high as the risk reward relationship is not advantageous.
I was very surprised that the P/E multiple expanded last year. The P/E expansion was mostly due to some global interest rates went negative, and the end of the year Trump rally.
Normally you have multiple expansion in the early phase of a market cycle from a low P/E with anticipated better economic and earnings trends.
In my September Market Outlook, I did write about several valuation metrics confirming that this market was overvalued. Click here to review the report.
Here is another valuation metric indicating that the markets are overvalued:

This is basically a price/sales (stock market capitalization divided by GDP) ratio answering the question how much are investors paying for a dollar of sales. The low has been as low as 50 cents to as high as $1.75 for a dollar of sales.
The current price/sales ratio may be understated as there are fewer companies that are listed when calculating the market value of U.S. equities. Review the first page to see the drop in listed companies.
The current price/sales ratio is close to historic highs.
I’ve written several times how important it is to monitor changes in economic and earnings’ forecasts. What is the trend of forecasts, are they improving, stable or falling? Identifying the trend can help an investor adjust their investment/trading strategy.
Below is an important earnings estimate trends chart that was recently published in the Wall Street Journal:

Let’s review the chart:
• Earnings estimates for 2017 were as high as 150; they have dropped to about 125. A few weeks ago the estimates were about 127. Will they continue to be revised downward as the year progresses?
• Years 2009 to 2011 were early in the market cycle and we can observe that the earnings were too optimistic early in the cycle so they brought the estimates down. They brought them down too much and then they had to raise them. Rising estimates are good for stocks and markets.
• As the cycle ages, we can still see earnings estimates are too optimistic, and they have to be revised downward. Notice in years 2014 to 2016, earnings estimates were higher at the start of the forecasted estimates but all three year estimates were brought down.
• Years 2015, 2016 saw very little earning growth and the market reflected stagnant earnings as can be seen in the market chart on page 3. Markets essentially traded sideways for much of 2014 to 2016.
• A pro-business, growth administration should be good for the economy. The markets, not sure as they are overvalued, and we are in the late stages of this economic and market cycle.
• Although some of President Trumps picks regarding the economy, and national security are impressive, President Trump’s credibility and his constant insults to domestic and international allies and enemies will make his difficult job more arduous.
Some of his cabinet picks (Attorney General, Secretary of Education, EPA), comments, and executive orders are causing social unrest.
Hopefully Trump’s advisers and cabinet members will be a buffer against some of his ideas and comments.
• The markets are overvalued by many metrics, (P/E, yearnings yield, market cap of market dividend by GDP, dividend yield). Read my September Market Outlook to review these metrics and valuations.
• It is normal for earnings’ estimates to be too optimistic, but as quarterly earnings reports are issued, especially later in a cycle, estimates are usually revised downward. We can expect earnings estimates to continue to be revised downward as the year progresses.
• On a technical analysis basis, the Trump rally is close to running its course. Can it go higher and become more overvalued, yes.
• Would I recommend chasing this rally and overvalued stocks and markets – NO!!
• I recommend be very selective with investment choices, and to be cautious, patient and disciplined.