2017 Market Review
Last year was normal for a market in the last stages of a market cycle. Below is a chart that emphasizes last year’s market:

In 2014, China was shifting their economic focus from exporting and manufacturing to the Chinese consumer. This caused many commodities to collapse and many of the countries that supplied China with commodities went into recessions. For example, oil prices collapsed from over $100 to below $30 and several oil producing countries went into recessions. It looked like the bull market could have rolled over, but last year most commodity prices recovered and so did the countries that supplied them. The elections also helped the market, the Trump bump.
Notice after the election, the price trend accelerated, especially late last year (dotted trend lines). The strong market performance was due to a pro-business administration, tax cuts, some deregulation at the federal level, and a synchronous global growth economy.
Another factor that caused prices to accelerate is a normal phenomenon of ‘new highs’ that is normal late in a cycle. After a bear market, it normally takes a few years to reach the old highs. Once prices break to new highs, most of the resistance and supply are gone, and it will be easy for prices to continue to make new highs; there were many new highs made last year.Parabolic, 90 degree moves are not sustainable, like most things in nature.
Parabolic moves are also a sign of speculation. The last parabolic move in late November did not go far and ended in some selling. Investors used the selling to buy. Tax reform was passed in late December, and we had another parabolic move.
Now our economy and markets are facing headwinds.
Bullish Case
Our economy is benefiting from tax cuts with job creation and an economy that is growing above 2%•Earnings are expecting to grow 18% to 20% in 2018.
- Earnings for 2019 are out, and if these forecasts are met, there is some upside for the markets.•After this year’s correction of about 10%, valuations are now fairly valued. See the valuation section below.
- As anticipated, we are seeing more buyback programs, mergers and acquisitions and some dividend increases thanks to the tax cuts.
- Consumer and business confidence remains high
- The global economy continues to grow•Declining supply of public companies to invest in. In 1996 there were about 7,000 public companies. Today there about 50% less. Less supply normally leads to higher prices.
- Some investors and traders remain bullish
- The President has gotten Mexico, Canada, China and North Korea to the negotiating table. If there are positive outcomes, this could lead to higher consumer and business confidence. The higher confidence could lift the markets higher.I will do my quarterly economic outlook next month.
I will discuss many of the economic topics brought up in the bullish and bearish cases e.g. interest rates, GDP, the consumer, the impact of tax cuts.
- Monetary policy (ultra-low interest rates, the Fed buying government securities to keep interest rates low) was a key to reviving the economy after the Great Recession and global financial crisis that started in 2008. This stimulus is now reversing - the Fed is raising rates, and reducing its balance sheet of the government debt they bought earlier in this economic cycle.
- The economic focus has shifted to fiscal policy (tax cuts, deregulation and federal spending). The tax cuts and increased federal spending will cause our deficits to explode (tax cuts mean less revenue for the government, but more government spending). This could be very risky if we go into a recession as we will have even less revenue and more spending on unemployment insurance. We also continue to have baby boomers retiring and applying for Social Security and Medicare benefits. This was not a good time for tax cuts.
- Investors are concerned about trade wars, especially with China.
- As I anticipated, so far the economy has not accelerated to the 3% level on a sustained basis.
- I wrote about the tax cuts for corporations and what they might do with the windfall from the tax cuts. Click here to read the report. As with past tax cuts for corporations, companies bought back stock, increased dividends, pursued mergers and acquisitions, capital spending including research and development. So of the windfall did go to workers as bonuses, increases to their retirement accounts and some raises.
- The consumer is 70% of the economy. Home, auto and retail sales have been disappointing for the 1st quarter of 2018.
- Oil prices have increased and this could put upward pressure on inflation and interest rates. Analysts are reporting that the small tax cuts to low income families will be wiped out by higher oil prices.
- Leadership in a market is important, as it tells where money is flowing in the economy. In the 1970s it was inflation hedges, in the 1980s it was consumer oriented stocks, in the 1990s it was technology, the first decade of the 2000s it was housing and financial stocks. Last year the leadership of the markets was technology. Technology is no longer leading, and the market lacks leadership. Without leadership, there is not a stock group that could lead the markets higher.
- Earnings are expected to be up about 18% in the 1st quarter 2018. Banks had good earnings, but the stocks sold off. I did write in my 2018 Market Outlook, “Normally investors won’t pay a high P/E for earnings that have increased from inflation, tax cuts, or one-time events (asset sales). Investors tend to pay up for stocks that have above average growth rates and have true operating earnings. Investors should not be buying stocks with high P/Es because of tax cuts.”
- There are several major geopolitical risks that the world and investors face: Syria, North Korea, Iran, and the Venezuelan economic and social crisis. Iran and Venezuela are major oil suppliers and if we have disruptions from these suppliers, oil prices could spike higher.
- The technicals of this market are creating topping patterns that are bearish. See technical analysis section below.
- As mentioned above, earnings are expected to grow to the high teens this earnings season and for the rest of the year. Normally the markets will rally in anticipation of a good earnings season, in other words buy the rumor and sell the news. Most of us thought the market could make a move to the markets old highs in this earnings season, but too many headlines of scandals, potential trade wars, criminal investigations…. stopped the rally off the lows of the year. Negative headlines could continue to be headwinds for the economy and markets.
- This economic and market cycle is showing signs of aging: it’s close to 10-years old, most economic cycles last about 5 years, interest rates and oil prices tend to rise toward the end of a cycle as they are now, consumer spending tends to slow as pent up demand from the cycle has been satiated, the markets are developing topping patterns, and there is no strong leadership in the markets.
- Whenever a party controls both houses and the presidency voters tend to vote in the party out of power to provide a check on the party in control. This will probably happen in the upcoming mid-term elections. This will make it more difficult for the President to pursue his agenda. It could also mean the Democrats could start the impeachment process.
- Special Council Mueller has made many indictments and four convictions. Some of the convicted will probably flip on the President. Paul Manafort the President’s campaign manager has been indicted for money laundering, tax evasion, and conspiracy against the U.S. Some in the media believe that the President will probably be charged with the same offenses, and also obstruction of justice and collusion with a foreign advisory. There will probably be more bad news for the President and his administration. If Muller files charges by the elections or after, the President will probably be impeached. I write about this because few analysts and the cable financial news channels rarely talk about this risk.
- Since President Clinton, the President’s job has gotten more complex and difficult. The Presidency is probably the most difficult job in the world and would be a challenge for anybody. If we go into a recession I don’t think this President and his economic team will be able to lead us out of a recession. The recovery effort will fall to the Fed, but they won’t be able to lower interest rates to stimulate the economy as they have in past recessions. During the Great Recession rates fell from 5% to 1/4%, a significant drop, and the ultra-low interest rates did help the recovery. Currently the Fed Funds rate is about 1 ¾% and the drop back to ¼% would not stimulate the economy as past monetary stimulus has.

Currently, the markets are close to fairly valued, if earnings forecasts are achieved. Earnings estimates for 2018 have been revised upwards since the tax cuts last December. For the last month, earnings forecasts have moved up less.
For 2019, the markets do have some upside, if earnings estimates are met. It will be important to see what happens to this estimates going forward. I will analyze and write about them in future monthly market outlooks.
Technicals, Price Analysis
Length of Bull Markets
Investors must understand that this market is getting old and is in the late stages of a market cycle. Most bull markets last about five years. Below is a table that shows the length of past bull markets:

First, this table is not accurate. There was a bear market in 1990 caused by the first Gulf War. We also had a brief recession in 1990. It would be more accurate to state that the longest bull market started in 1990 and ended in 2000, still the longest bull market. This long, powerful bull market was powered by the technology, digital revolution.
The long length of the current bull market is mostly due to lots of fiscal and monetary stimulus, especially ultra-low interest rates, and an economy that did not overheat and had low inflation.
Major Market Reversal Patterns, the End of Bull Markets
Most markets end with what’s called major reversal patterns. I’ve studied these topping reversal patterns going back to 1917. Here is my analysis:

The yellow shaded years are corrections or bear markets that did not coincide with a recession. Non-yellow shaded years are bear markets with recessions.
According to my research, most bull markets end with a rounding top pattern. Most market tops last about 14 months.
Current Major Reversal Pattern
Here is a current chart of this bull market:

Source: www.erlangerchartroom.com
Let’s review the Dow 30 chart:
This bull market started in 2009. In 2014, the market started a topping pattern, rounding top. The topping pattern, trading range lasted more than 2 years.
The market got a second wind after the elections. Also, once prices broke out to new highs, its normal to continue to make new highs until a new resistance level has been established.
The 2017 market performance would have been difficult to sustain in 2018. By the end of the 2017 the Trump bump was overbought and overvalued.
As listed above, the market has many headwinds, and the Trump bump has turned into the Trump slump.
A new trading range has been established, once a new market high was made in late January. The new trading range now has support around 23,500 and resistance is around 26,600.
I consider this a topping pattern that started in November of last year. This means the topping pattern is about six months old, and as the table above states, the average topping pattern lasts about 14 months. This pattern could take us to the mid-term elections. Remember the market is a leading economic indicator and leads the market by at least six months.
In the medium-term, the market is forming a bearish descending triangle. Participants are selling the rallies, dotted trend line. If prices don’t hold support, the 23,500 area, the market could have another leg down.
FAANG and Market Leaders Are Forming Major Market Reversal Patterns.
In my February Market Outlook I included the Apple chart below:
Source: www.erlangerchartroom.com
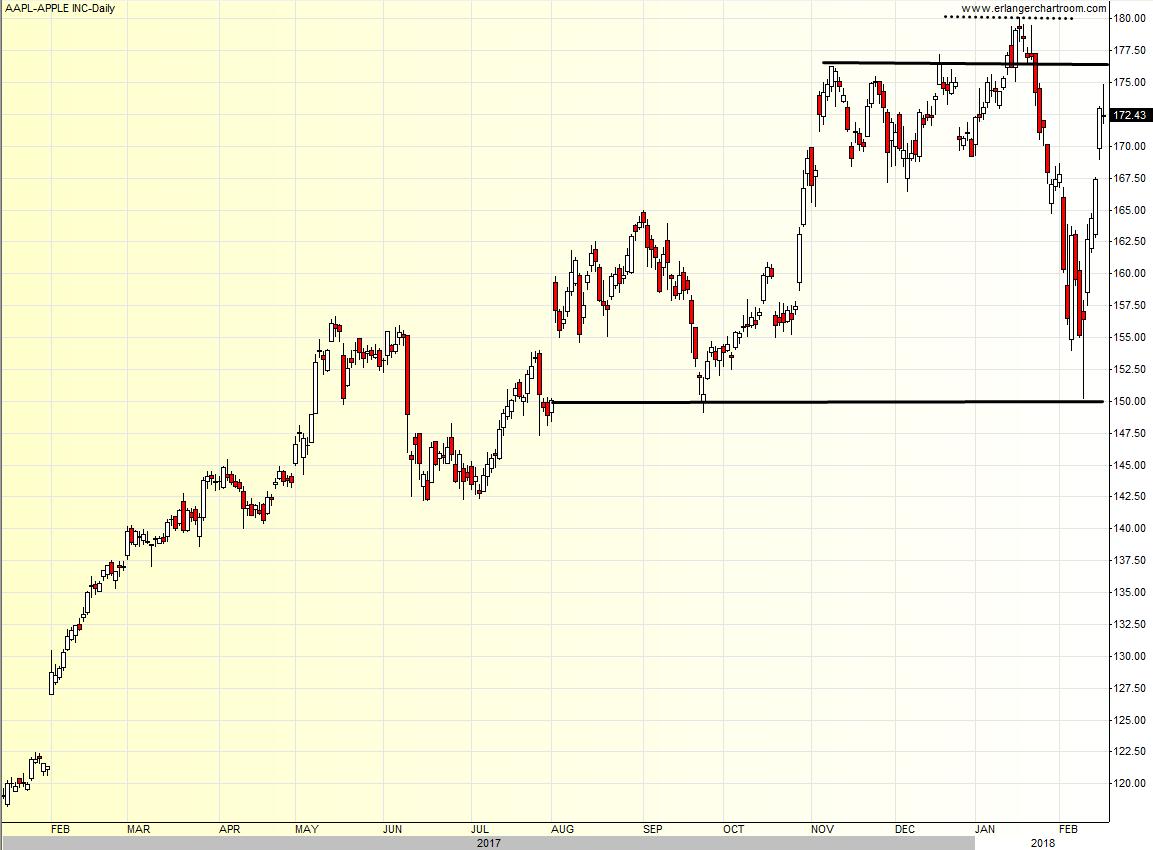
Apple started its topping pattern last July with support around $150 and resistance around $180. I suggested that this would be the new trading range for Apple in my February Market Outlook.
Here is a current chart for Apple:

Source: www.erlangerchartroom.com
Apple is continuing its trading range, and it did test the resistance area in March. Apple does have a chance to test the resistance area this earnings season and the 2nd quarter earnings season that starts in July.
It looks like the major reversal pattern that is developing is a rounding top, also called an umbrella.
We can also look at the ETF QQQ where the top holdings of the ETF include the popular FAANG stocks (Facebook, Apple, Amazon, Netflix, Google). Here is a current chart for QQQ:

Source: www.erlangerchartroom.com
The QQQ does not look as bearish as the Dow 30 chart on page 7.
The QQQs started its major reversal pattern last November; it now about six months old.
I thought the ETF would test the resistance level during this earnings season, but as mentioned above, trade war concerns, rising interest rates, rising oil prices, and White House scandals have been headwinds for the markets including the QQQs. There is still a chance for the QQQ to test the resistance area this earnings season and the 2nd quarter earnings season.
If prices don’t make new highs by the summer, the 2nd quarter earnings season, there are more headwinds than positive catalysts for the economy and markets. This means the major market reversal topping pattern could turn into a bear market.
Stocks Entering Bear Markets
I have been buying dividend paying stocks for my retired clients and myself. They were the market leaders for much of this market cycle.
Below is a chart of Kimberly Clark, symbol KMB:

Source: www.erlangerchartroom.com
Many dividend paying stocks like KMB peaked last year; KMB is down close to 30% from its peak, bear market territory. The topping pattern took about 13 months, and it broke support last month and had another leg down. These stocks were the leaders in the early part of the bull market, and it looks like they’re leading the markets down.
KMB’s major market reversal pattern was very bearish with a declining tops pattern, participants were selling the rallies.
I will write more about bottoming/basing patterns when the time comes. It’s very rare that after a low is made that it makes a V shaped recovery.
My retired clients did own KMB, but the parabolic move in early February of 2016, and its high P/E caused me to sell. I am starting to nibble at some of these stocks that are in bear markets, but if we do go into a recession we could get another leg down.
If we don’t make new highs by the summer, the markets could break support, topping pattern and turn into a bear market. The causes are listed in the Bearish Case section above.
Summary & Conclusion
- Last year we had the Trump bump, and this year we have the Trump slump.
- This year there are positives for the economy and markets, but there are growing concerns and headwinds. The bullish and bearish forces will keep this market in its trading range. There are more catalysts for a bear market than catalysts for a resumption of the bull market.
- Currently, the markets are close to fairly valued. If prices move to resistance, then the markets become overvalued and buying could dry up. Buyers will probably come in at the support level. This is another reason why the markets could be stuck in a trading range.
- The market should be in rally mode in earnings season, but bad headlines news has kept the rally from rallying to resistance.
- If the markets can’t make new highs by the summer, then the markets could turn bearish.
- Many stocks are forming bearish major reversal patterns.
- Some stocks have entered into bear market territory.
- Investors should be patient disciplined and cautious. Raising cash and reducing risk also makes sense. I did write an article on how to de-risk a portfolio. Click here to read the article.