Below is an important chart that I’ve introduced in a previous article as it evinces the cyclicality of our markets:
I learned about the importance of knowing about cycles (market, economic, interest rate, political, product…) at UCLA’s Graduate School of Management.
Below is an important chart that I’ve introduced in a previous article as it evinces the cyclically of our markets. In this report, I provide more details on a few of the phases of the market cycle:
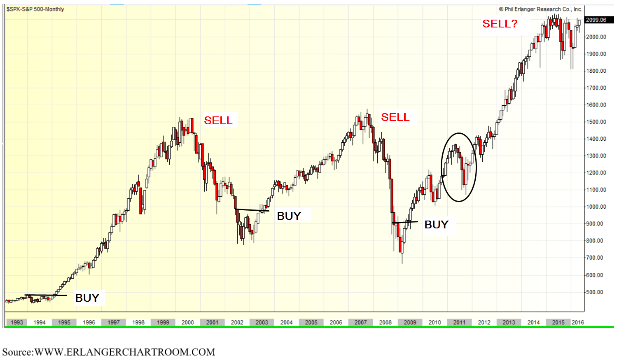
The chart above covers about a 23-year period. If I was to go back 50-years you would see similar patterns, cycles.
As I’ve written about before, we are in the mature, sell phase of this market cycle, and the strategy for this part of the cycle is caution. I will write more about another strategy for this phase of the market in an article I will issue later this week or early next week.
The phase that I get excited about is the buy, basing phase; it will take time to get to this phase, and I will let our readers, clients know when we are in this phase of the market. Briefly, the basing, buying phase takes about seven months, so investors have time to accumulate shares. At the beginning of the phase investors should remain cautious, as a bottom still needs to be found.
Once a bottom has been made, and the earnings outlook starts to improve, then investors can be more aggressive, as valuations are low and stocks and markets are oversold. Again, I will write more about the buying, basing phase when we enter that phase.
As I wrote about above, the basing, buying phase (when valuations are undervalued, and stocks and the markets are oversold) take about 7 months, on average. Sometimes the basing period can take much longer. The NASDAQ 100, symbol QQQ, in the first decade of the 2000s, is a good example:

The above chart provides the full cycle, from the panic phase to the mature, topping phase including a very long basing phase.
Let’s review the chart:
- Panic phase, this is one of the reasons why I recommend investors raise cash during the mature, topping phase. Losses are normally significant during the panic phase.
Topping, mature phases last from 6 months to several years.
Behavioral Finance describes the panic phase as a biological response where cortisol, the flight or fight hormone, is produced in the body that causes most investors to react on emotions (fear and panic) versus being rational.
Notice that most of the loss was made in less than one year, but it took more than a decade to reach the previous peak. It is normal for the panic phase for losses to happen quickly, and the basing and bullish phase to take longer. Not as long as the phases in the above chart.
- Basing, buying phase gives us the opportunity to buy stocks when valuations are much lower, and prices are oversold. This is another reason why it’s very important to raise cash, so you may have the cash to invest in companies at bargain prices.
It’s always important to pay attention to the economy and the fundamentals of the companies you’re interested in investing in:
In the QQQ chart above, the markets reflected the recession of the early 2000s, the panic phase.
The basing period and recovery phase from around 2002 to 2007 reflecting the recovery, and the housing boom of the period. The QQQ went from around 20 to around 50. Prices were never able to break out of its basing pattern before the housing bubble popped.
In 2007, 2008 the economy faced the popping of the real estate bubble, and that led to the global financial crisis. The market did go through another panic and basing phase. The basing phase in this cycle took about a year.
Again, I will write more about the basing, buying phase when we enter that phase. The key is buying undervalued companies.
To use a surfing analogy, the basing phase is similar to sitting on your board, preparing for the next great wave.
- Growth bullish, phase. Once the basing phase completes, the growth bullish phase starts, but it must accompany an economic recovery, and earnings that go from contraction/losses to growth.
At the beginning of the growth phase, valuations and prices are low. Most growth phases last at least four years, and the strongest gains are normally made the first few years of the recovery. Notice that there are more white candles, a sign of strength and buying at the beginning of the bull market, and we see more red candles during the mature phase, signs of selling.
It is best to buy and hold during the growth, bullish phase. It’s fine to add to position on pullbacks and consolidation periods during the bullish phase.
In the QQQ chart above, the bull market started in 2009. This bull market has been longer than most. I’ve written in the past, that the longevity of this bull market may be due to slower growth and that the Federal Reserve has not had to raise rates to slow down an overheating economy and inflation.
The market is now in the topping, mature phase. The key here is to sell your stocks that are now probably overvalued, and to raise cash for the next cycle.
Going back to my surfing analogy. The growth bullish, phase is similar to finding that wave and riding all the way to shore, the mature phase, and not ride the wave for a wipeout, panic phase.
I will write more about the topping mature phase, the current phase, in my next outlook, article that should be out toward the end of this week, or early next week. I will include the investment strategy for this phase.