This report will provide metrics and a model on how to de-risk a portfolio. Once you determine which stocks, ETFs have the most risk, consider taking profits, or selling. The proceeds can be held in short-term money markets (CDs, T-Bills, commercial paper, money market funds). With lower allocation to equities will mean you will lose less in an inevitable bear market and you will have liquid funds to invest in the next bull market cycle at cheaper prices.
Risk Model
There are many ways to analyze a stock portfolio for risk. This model focuses on what stocks could fall the most when a bear market starts. Below is the model I developed. I analyze AAPL (AAPL) and Amazon (AMZN) for risk:

There are five components to the model: 1. Valuations 2. Volatility 3. Liquidity, Debt 4. Share Analysis 5. Risk Score
Valuations
Stocks, markets that are overvalued can become more overvalued, but eventually they become fairly valued, and in bear markets that can fall to undervalued. This is why you want to have liquid assets in a bear market, to invest in equities that are undervalued, and that in the next cycle can grow to fairly valued and possibly overvalued.
Below is a brief description of the valuation metrics I use to analyze risk.
P/E
The P/E is very important, but a simple (price over earnings) valuation metric. I wrote an article The P/E Ratio – Simple and Powerful that explains the P/E and why it’s so important.Click here to study the article. The P/E basically tells us what investors are paying for a dollar of earnings.
Below is a chart that shows the history of the P/E, again how much investors paid for a dollar of earnings.
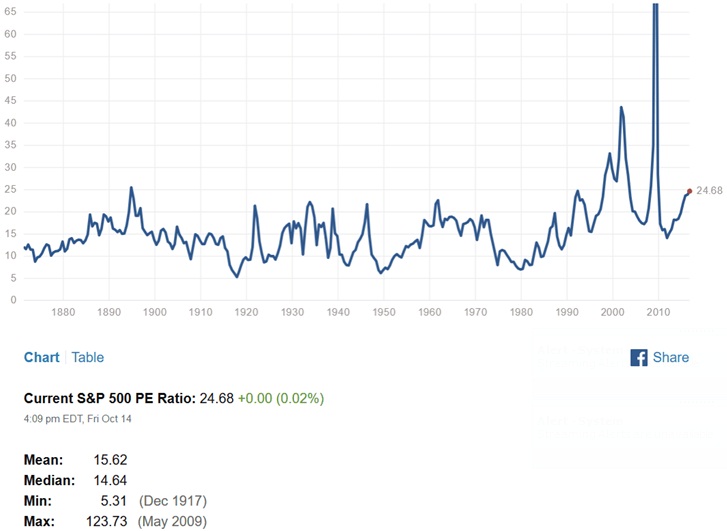
Source:v Factset
The above chart starts in the late 1880s to 2016. If we take out the extreme highs and lows, the high is the high teens to above twenty and the lows are in the low teens.
The average historic P/E is about 15.62. Currently the P/E for the S & P is about 17.60, the markets are overvalued.
Below are the P/Es for AAPL and AMZN:

The P/E for AMZN shows that the stock is very overvalued. AAPL’s PE seems reasonable, but is overvalued in a few valuation metrics below.
Price/Sales
P/S tells us how much investors are willing to pay for a dollar of sales. Earnings can be manipulated and the components of an income statement and earnings forecasts have many estimates. Also, we normally look at estimates for the following year, so the P/E is normally based on earnings estimates. Sales are harder to manipulate and is a more reliable number.Another way to look at P/S is by dividing the market capitalization of the market by the U.S. GDP. Below is a chart with a historic look at the P/S for the market:

Source: FRED
The average P/S since 1950 is about 70%. The market is over 100%. The market is overvalued according to P/S.
Below are the P/S for AAPL and AMZN:

Investors are paying about $6.67 for a dollar of AAPL sales. Investors are paying about $4 for a dollar of AMZN sales. Both stocks are expensive using the P/S valuation ratio.
Average Price Target / Current Price
Many stocks are covered by stock analysts; some analysts provide price targets for the stocks they cover. The consensus price forecast (the average of analysts’ price forecasts) is an important price target as prices tend to gravitate to the consensus price target, forecast.
I compare the current price to the consensus forecast. If the current forecast, is higher than the current price the stock could have some upside and may be worth keeping till it reaches its price target. If the forecast is below the current price, then the stock is probably overvalued and is a sell candidate.
Let’s look at AAPL as an example:

Source: Yahoo Finance
The summary information includes the consensus price target of $192.54. The current price is $178.54, so according to the consensus price target, AAPL does have some upside.
Below are more details of the consensus price target:

Source: Yahoo Finance
The price target is based on 35 analysts’ average price target with the low estimate of $152 and the high of $220. Normally when there is a wide dispersion between the high and the low it normally means the stock will be volatile as there is a big disagreement among analysts regarding the valuation of the company.
Most of the price targets are based on discounted cash flow valuations and, or its estimated future earnings times an appropriate P/E. I noticed last year that many analysts had been raising their estimates based on the willingness of investors to pay a higher P/E. This is dangerous this late in the cycle, and also paying for earnings based on tax cuts and not operating earnings is not prudent. Take the price targets with a grain of salt this late in the cycle. They are normally helpful for much of a cycle.

According to analysts’ consensus price targets, the upside for both stocks is less than 10% (both stocks are worth about 90% of their price targets). If we have a bear market, the downside is about 30% (see Risk Score section, the downside is probably closer to 50%). Not a good risk reward ratio (30% to 10%).
Market Capitalization / Stockholder Equity
Market Capitalization, MC, is the current price times the shares outstanding, the amount to buy the company outright (the buyer would be responsible for the debt of the company). The stock holder equity, SE, is basically all the company’s assets minus all the company’s liabilities.
This ratio basically tells us how much investors are willing to pay for a dollar of equity.
In a bear market, the theatrical downside of a stock, company is the shareholder equity of the company.
At the time of the writing, AAPL’s MC is about $900 billion. At this valuation, AAPL would never be acquired because no business or private equity fund has that much money to buy AAPL, and this is one of the reasons why AAPL had a low P/E.
SE is about $126 billion in equity, a lot lower than its MC. Investors are paying about $7 for a $1 of equity. Would you pay $900 billion for a company that has about $249 billion in sales and SE of $126 billion?
Could a $249 billion company double and triple its sales. Walmart is close to being a $500 billion company and its sales have slowed dramatically. Most companies that grow to this size, stop being growth companies.
Below is the MC/SE for AAPL and AMZN:

Investors are paying an expensive $7 for a dollar of equity for AAPL. AMZN is selling for $53 for a dollar of equity, CRAZY!!
Profit Margin
A profit margin is basically sales divided by net income. If a company has a high profit margin and we go into a recession, the company can probably still have earnings.
A company with low margins will probably have losses in a recession.
Below are the profit margins for AAPL, AMZN:

AAPL’s profit margin is a rich 21%, so it could probably avoid losses in a recession. AMZN’s profit margin is a thin 1.7%, and would probably have losses in a recession.
Volatility
Beta
From a mathematical explanation, the beta is a linear regression of a stock and the market. In other words, it’s the sensitivity of a stock to a movement of the market. A beta of 1 would mean that the stock moves the same as the market.
A beta of 1.5 is a high beta and would mean that a 1.5% change in the return of the stock for every 1% change in the market.
Here are the betas for AAPL, AMZN

The beta for AAPL isn’t as bad as the AMZN beta. A high beta in a down market will probably be down much more than the market. High beta stocks make sense at the beginning of a bull market.
Liquidity & Debt
Current Ratio
The current ratio (current assets divided by current liabilities) tells investors about the ability of a company to pay its short-term liabilities. When I took finance classes many years ago, a ratio of 2 (there is $2 for every dollar of short-term liabilities) would be recommended and safe. A ratio of one tells us a company is living paycheck to pay check, not a good position to be in.
Below we see the current ratio for AAPL is 1.28 and would be barely acceptable in a recession. The current ratio for AMZN is an unsafe 1.04.
Long Term Debt/Revenue
The LTD/Rev puts into perspective the amount of debt is used to generate revenue. The higher the percentage, the more vulnerable the company could be in a recession. In a recession, revenue is likely to be lower while long-term debt is a fixed cost and this could create financial problems.
Below is the current ratio and LTD/Revenue metrics for AAPL and AMZN:

AAPL has a higher debt ratio, but much of the debt is at very low rates. They do have plenty of short-term assets to pay most of it down.
Share Analysis
Shares Outstanding/Float
Not too many equity analysts study the shares outstanding, float of a stock. The shares outstanding is the amount of shares that a company has issued and sold to investors. The float is the shares outstanding minus shares held by insiders. In this report we will focus on the float of a stock.
At the beginning of a bear market, the float is important. A stock that has a small float will move more because there is less money flow needed to move a stock. When the selling happens, it will be easy to move the stock lower. A stock with a large float will be harder to move, and will probably fall less, and slower than a stock with a small float. At the beginning of a bull market, theoretically, the small float stock will move higher and faster.
AAPL has about 4 billion shares of float and may be safer in a down market. AMZN has about 400 million shares, so it will probably move lower and faster in a bear market.
Institutional Ownership (IO)
By definition IO, is the institutional (mutual funds, hedge funds, endowments, insurance companies…) ownership of a stock.
At the beginning of a cycle the IO can be as low as 0 to 30%. The low ownership normally increases as the cycle improves and these elephants can be an important variable that pushes the stock higher.
At the end of a cycle, institutional ownership can increase to as much as 90% and as we get at the peak of a cycle, these institutions can crush a stock when they liquidate.
Both AAPL and AMZN have IO in the 60% range. Not dangerous, but a risk that should be considered.
Short Ratio
Shorting a stock is a bearish move by a speculators, investors. Basically, shorting a stock happens when an investors borrows stock and then sells short the borrowed stock. The investors anticipates a lower price uses the proceeds of the short sale to buy the stock back, replaces the borrowed stock and keeps the difference. Example: You sell short a stock at $100 per share. The stock falls to $70. You use the $100 to buy the stock at $70 and replace the borrowed stock. You keep the $30 difference.
The short ratio is the amount of shorted stock divided by the average volume per day. This tells us how many potential buy days of short covering.
A high short ratio means there could be meaningful potential future buying of the stock. A high short ratio also means that investors, speculators are bearish on the stock. Many times the shorts have good reasons to be bearish on a stock.
Both stocks have low short ratios.
Below are the share data points for both stocks:

The main concern here is for AMZN that has a smaller float and could move lower and faster once a bear market starts.
Risk Score
I’ve given a score for each risk measurement. The riskier the risk measurement I give a score of 5 to 4. The measurements that have less risk, but are still important have a score of 3.
The highest risk score is 44. A score of less than 10 is the safest. Scores from 10 to 25 are below average risk. Scores from 25 to 35 have above average risk and scores above 35 have high risk.
AAPL has above average risk. If you have a large profit is AAPL you could consider taking profits. AMZN has high risk and would probably fall the most in a bear market.
Here are the risk scores for each stock:

A bear market means the market and stocks will be down at least 20%. Stocks that have higher risk are usually down much more.
Below are charts of both stocks in past bear markets:

In the “tech wreck” of the early 2000s, AMZN was down about 95%. In the bear market that started in 2008 AMZN was down about 65%. The downside risk for AMZN should concern AMZN investors. I do realize that AMZN is a different company today vs. 2008.
Below is a long-term chart for AAPL:

Source:wwwerlangerchartroom.com
In the bear market that started in 2008, AAPL was down about 60%.
I was a stock broker with Merrill Lynch in the early 1980s when AAPL went public. I had friends and clients ask me if I can get shares for them, but the shares went to institutions and the whale retail clients. In hindsight, it was a good thing that they did not get the shares as AAPL essentially was dead money for about two decades; investors and traders forget the long bearish trend of AAPL. It was the IPhone that changed the fortunes for AAPL.
Summary
The investment industry has developed many ways to measure risk. I focus on analytics that can help an investor determine what stocks are the most vulnerable as a bear market starts.
Here is the risk model with AAPL and AMZN as examples:

The most important risk measurements are valuations. Debt and liquidity levels can also let us know which companies could get into financial trouble in a recession.
Both stocks are risky, but AMZN probably has the most downside risk.
If you have questions on how to reduce the risk in your portfolio, please feel free to contact me:danhassey@yahoo.com.