Bullish Case
Bearish Case
Major Market Targets
Below are the price targets for the major markets based on the current consensus earnings estimates:

- Earnings forecasts for 2017 are higher.
- The fear of a U.S. recession has been reduced by analysts and investors.
- Interest rates, inflation and oil prices remain low, and are good for the economy and asset prices.
- Oil and many commodity prices have recovered relieving concerns of defaults of energy and commodity related companies.
- The dollar is stabilizing, causing earnings forecasts to improve, especially for 2017.
- Credit spreads are improving, narrowing
- There have been articles in the financial press that investors will be able to adjust to a rise in rates. Normally, a rise in rates have been disruptive to the markets.
Bearish Case
- China and the global economy are slowing
- China’s slowing and change of focus from investment, manufacturing and exports to a consumer and services focus are causing disruptions in the Chinese and global economies, especially resource based economies.
- Latest terrorist attacks are bad for the European Economy, and its anemic growth
- Isis and the Middle East create uncertainty, instability and danger
- Earnings continue to be revised downward for 2016 and 2017
- Markets are now overvalued (see forecasts below).
- Global central banks, and especially ours, are running out of effective monetary bullets to help our economies, especially if we have a global recession or major financial crisis
- The collapse in oil prices is hurting many energy based economies (Russia, Mexico, Venezuela, Nigeria….). Low oil prices are also hurting the U.S. energy industry and we’re seeing more layoffs, bankruptcies, and banks are worried about more energy loan defaults.
- This economic and market cycle is maturing and may enter a decline phase (some indexes have entered decline, bear markets).
- The Fed may raise interest rates at least one more time this year. This could be disruptive to the debt and equity markets.
- If the British vote (June 23) to leave the European Union, the decision could lead to more European economic weakness, and global market disruptions.
- The elections are causing concerns among economists, analysts and investors.
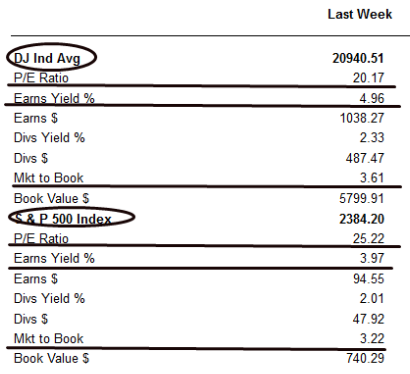
Major Market Targets
Below are the price targets for the major markets based on the current consensus earnings estimates:
Source: Consensus Earnings Estimates Thomson Reuters, Barron’s
If these forecasts are correct (analysts continue to lower their earnings estimates), then the markets are overvalued this year and fairly valued for 2017 using a moderate P/E. I use a lower P/E because of the lower growth, higher risks, and the aging of this economic and market cycle.
The last 3 rows I do use a slightly higher P/E for 2017, and if investors do pay a higher multiple (I don’t believe in paying a higher multiple for the reasons listed above) then the markets do have some upside for 2017.
Markets Stuck in a Trading Range
Below is a chart of the market stuck in a trading range going back to late 2014:
Source: www.erlangerchartroom.com
Let’s review the chart:
Market Technicals: Long-Term View, Buy Low & Sell High
As mentioned above, the markets are developing major topping reversal patterns, similar to the major topping patterns in 1999, 2000 and 2007, 2008:
Let’s review the chart:
- The markets have been able to recover from its market correction earlier this year.
- Despite the weak 1st quarter earnings’ season and high market and stock valuations, the market has help up fairly well, and held support at the 2040 level.
- It’s possible that prices could rally to the old highs of last year, as most participants aren’t selling, leaving this market.
- If prices rally to the old highs, then the market becomes even more overvalued and it would be hard for the market to attract new buyers.
- The market has longer-term support at the 1875 to 1825 area. At this level the market becomes undervalued and would probably attract buyers.
- We may be stuck in a trading range from the 1875 to 2130 area.
- The markets pattern is bearish: it’s taking over a year to develop, it’s developed after a six year market bull market, the pattern is considered a bearish major market topping reversal pattern.
Market Technicals: Long-Term View, Buy Low & Sell High
As mentioned above, the markets are developing major topping reversal patterns, similar to the major topping patterns in 1999, 2000 and 2007, 2008:
For many years, I’ve studied the market cycles’ tops and bottoms. The current market has similar
characteristics to most cycle’s bottoms and tops. Let’s analyze the market cycles above and the
investment opportunities they create.
We see many red flags in this market.
Question – is it prudent to buy during this topping pattern, and this late in the economic and market cycle? What’s your upside (maybe 7% according to my forecast for 2017) and downside (most bear markets are down 30% from a peak)? The risk, reward relationship for today’s market is not favorable.
There are industries and stocks that are in bear markets, and we’re starting to look at those stocks and industries for some opportunities, but its best to keep you’re powder dry to buy at the bottom of the next bear market. The risk, reward relationship is very good after a bear market.
- Technical analysis books suggest investors buy when prices break out of a bottom. I basically agree, but investors can start buying before the breakout.
- The bottoming phase, also known as basing normally takes about seven months. Also during the basing period a bottom will be made and a test of the bottom will be made at least once. Buying could also start after the second test of the bottom. Also, earnings start to improve, and is another signal to start buying.
- Most bull markets last about four to six years, so once you buy its best to hold for four to six years.
- In 2011, the markets came close to entering a bear market. The weakness was caused by global events including the potential collapse of the Eurozone, the Arab Spring, and the triple Japanese tragedy (earthquake, tsunami, and nuclear site disaster). Similar to 2011, most of our risks are from outside the U.S.
- On a technical basis, after a bull market rally that lasts four to six years, we see a topping formation that lasts at least six months. We see these formations in 1999, 2007, and now. Also, we see after a bull market of four to six years the market doubles in price, valuations go from undervalued to overvalued, and economic and earnings growth comparisons get more difficult this late in a cycle.
We see many red flags in this market.
Question – is it prudent to buy during this topping pattern, and this late in the economic and market cycle? What’s your upside (maybe 7% according to my forecast for 2017) and downside (most bear markets are down 30% from a peak)? The risk, reward relationship for today’s market is not favorable.
There are industries and stocks that are in bear markets, and we’re starting to look at those stocks and industries for some opportunities, but its best to keep you’re powder dry to buy at the bottom of the next bear market. The risk, reward relationship is very good after a bear market.