I normally write a monthly market outlook, but the last few months I’ve been analyzing and reporting about Trumponomics.
This month I provide an outlook for the markets.
Bullish and Bearish Case
Bullish Case
- Global economy growth is anemic, but it is improving.
- The U.S. economy is doing fine.
- U.S. earnings growth is finally improving.
- A pro-business and growth administration has investors and business people optimistic.
- The new economic and military teams are very accomplished.
In the mid-1990s, there were about 7,330 listed companies in the U.S. stock market. Today there is about 3,700. Less supply, could mean higher prices if the listed companies stay this low, or goes lower.
Bearish Case
- Valuations, see Targets and Valuation sections below
- Late in cycle, valuations high, downside risk significant
- Rising geopolitical risks: North Korea, Syria, terrorism by Islamic extremists, Iran, Iraq, Venezuela, Afghanistan, Brexit.
- Fed is raising rates
- Trade wars remain on the table. Canada latest focus. Trump may initiate tariffs for Mexico’s sugar.
- There are signs the consumer is slowing down, about 70% of GDP, especially auto and retail sales.
- Dysfunction in Washington
- Black or grey swan events, low probability and unpredictable events with high impact to the global economy.
- China, and its high debt levels. Many economic recessions start when there is too much debt, and interest rates start to rise. If China goes into recession, it will be felt globally.
- Some in the new cabinet are divisive (Attorney General, Education, Energy, EPA…), and could continue to cause more social unrest.
- The new administration is under FBI investigation regarding Russia and the elections.
- President losing credibility with tweets, misstatements, and insults to friends, allies and enemies. Credibility is important, especially for global leaders.
Below are my market forecasts:

The historical market P/E has averaged about 16.5. It’s normal for the P/E to get higher than 16.5 toward the end of a market cycle. I use a 16 P/E for the Dow 30 because the index is filled with large mature companies that have slower growth. The S &P earnings forecast has a higher growth rate and therefore I use a P/E of 17. By using a normal P/E, the markets are overvalued. If we use a higher P/E, the markets are still overvalued.
One of the reasons for the market’s recent strength has to do with expected double digit earnings growth for 2017, after about 3 years of weak earnings. The good news about anticipated earnings growth is already reflected in the markets and stock prices. Let’s take a closer look at earnings forecasts for the markets:

The above table is from Barron’s and it shows earnings for 2016, and forecasts for 2017 and the current P/E based on 2017 forecasted earnings.
The forecasted growth rate is about 19% for 2017, but if we take out the highest growth companies, the growth rate is about 8.8%.
According to the table, only about a dozen stocks have double digit growth, and most have single or negative growth. The stocks that have double digit growth have very high multiples and most of them reflect the anticipated double digit growth.
Exxon and Mobil have the highest growth rates. The high growth rates are due to much better oil prices this year and cost cutting. Even though their earnings recovery is significant most energy stocks are laggards. Energy stocks negative price trends are not attractive to trend followers and momentum players. Momentum players like stocks with earnings growth and a bullish price trend. These stocks are very undervalued on a sum of the parts basis. Both stocks also pay above average dividends.
I highlighted three other companies with high growth rates. Boeing and Caterpillar have high growth rates but they also have historically high P/Es and market capitalizations. The current growth rates are not sustainable with these large market capitalization companies.
Apple is a consumer and investor favorite; they do make great smart phones. I often read and hear that Apple is cheap because of its P/E, 15.5, and double digit growth rate. Apple just announced disappointing earnings report and outlook, so the $9.26 forecast may have to come down. The stock is up about 25% so far this year, despite a questionable forecasted growth rate of about 13%. Apple’s price appreciation has gotten ahead of itself.
Also, we have to remember that we’re not just buying stocks, but companies. The market value of Apple is about $770 billion. Would you buy a company for $770 billion with revenue of about $218 billion? When I invest in a company, I always want to know how much another company would pay for my company in an acquisition or merger. No company would pay $770 billion, and neither would I.
Valuations
On the cable financial news channels, there is much discussion about valuations. Some investment experts are concerned about the high valuations and the age of this market and economic cycle. Some believe the markets are justified for their current valuations because the economy and especially earnings are doing fine.
Below are some market valuation metrics that are published in Barron’s every week:
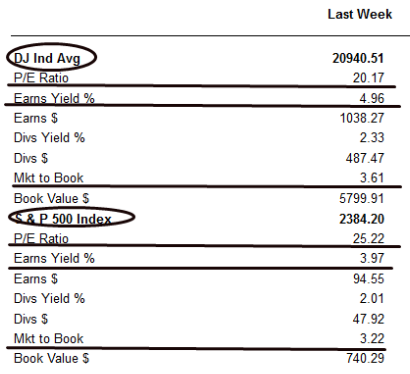
I also underlined the Earns Yield %. The earnings yield is the inverse of the P/E, E/P. I wrote an article about the P/E and I included a section on the earnings yield. Here is an excerpt:
“The question investors should ask is, “Why invest in a stock if the government will pay more and the rate and principal are guaranteed?”
The earnings yield was made popular by former Federal Reserve Chairman, Alan Greenspan. Mr. Greenspan used the earnings yield to determine the valuation of the market. He compared the 10-year Treasury note to the Earnings/Price of the SPX based on estimated earnings.
Today’s earning yield would be about 5.8% ($125 2017 S & P earnings est. divided by 2120 S & P price). The 10-year is now at 1.87%. According to the earnings yield stock market valuation model, the market is undervalued. Any new money in the market should gravitate to the higher yielding stock market.
Central banks around the world are keeping interest rates very low. Historically, the 10- year Treasury is at least inflation plus a 2% to 4% premium. Inflation averaged about 1.90% for the last five years, and if we use a 3% premium, the 10-Year should be about 4.9%. Using this more appropriate comparison (4.9% 10- year Treasury versus 5.8% for the E/P) the choice is not as obvious.”
I wrote this article last November, so here is the current comparison: earnings yield is about 5.4% ($129 2017 consensus earnings estimate divided by 2388 S & P price). The new inflation adjusted 10 year Treasury is about 5% (inflation is about 2% plus the premium is about 3%). If Treasuries weren’t so overvalued, today’s Treasury yield barely keeps an investor ahead of inflation, then the choice would be a Treasury because it would be safer. But, because both are overvalued, I personally have a significant amount of my money in cash.
The market to book value also points to an overvalued market. The market value is about 20,900 and the book value is about 5,800. So investors are paying about 3.6 times the market’s book value. Admittedly, book value is less useful in a knowledge, service based economy versus a bricks and mortar economy.
Lastly, for the last several years the dividend yield was much better than treasuries, but now Treasuries, 2.3% yield beats the market dividend yield, a little bit more than 2%.
The four metrics conclude that the market is overvalued. The risk reward relationship at these valuations is not in favor of the investor.
There are participants in the markets that don’t pay attention to valuations and market and economic cycle. Some of these participants include:
- Fast money and traders
- Momentum players who focus on earnings and price momentum.
- Trend followers go long on strong uptrends and short weak trends
- High frequency traders, HFT, are fairly new participants that trade millions of times a day for pennies. Some HFTs trading is based on arbitrage among different exchanges, options, and futures markets. They have ultrafast computers and are wired directly into exchanges to monitor order flow, and make millisecond decisions and trades.
- There is a whole generation of professional portfolio managers, and security analysts who use computer programs to make investment decisions. These investors went to the same MBA programs that taught the same valuation metrics, and other indicators to pick stocks. They also learn how to model their investment decision making. Many of these algorithms for decision making are picking the same stocks which tend to push up the same stocks making them expensive, and are also causing “crowded trades”.
- There are also millions of financial advisors that invest their client’s money in ETF indexes and use asset allocation and rebalancing as their investment strategy. Some do pay attention to valuations, but most don’t pay attention to economic and market cycles.
The above strategies (less for asset allocators) are risky and provide mixed results at best. These participants are keeping the markets elevated, and they don’t seem to be adjusting to risks listed above.
I’ve written several times, but it’s worth writing again - markets can move higher when they’re overvalued, but in the long-run, overvalued assets eventually return to fair value and sometimes go lower to be undervalued. Undervalued assets can fall to be more undervalued, but if it’s a solid business, it can return to fair value, and if you’re lucky it can appreciate to overvalued.
Technical/Price Analysis
Below is a two-year chart of the market:

The markets were essentially going sideways for almost two years (the topping, sideways movement started in 2014) reflecting flat earnings growth.
The markets went parabolic after the elections based on the pro-growth and business agenda of the new President.
The market started to consolidate in February. The market has rallied back to its old high in anticipation of a strong earnings season. If the earnings season is strong enough, then prices could break to new highs. This is happening with the NASDAQ (see the NASDAQ 100 chart below).
If stocks can’t break to new highs, then the markets could be stuck in a trading range with resistance around 2400, and support either 2325 or 2275. This would follow the sell in May and go away strategy. The reason why this strategy works in most up markets is because the market tends to anticipate the following year in November. By May, the prospects for the year are reflected in the markets, and the market tends to go sideways. There is sometimes a summer rally. The weakest months are normally September and October. The seasonality of the markets starts over again in November. Below is a chart that shows the seasonality of the market:

The chart covers 17 years. The r for 2017 is .36, an adequate relationship (the closer to 1 the better, a -1 would be a negative relationship)
For traders, you can buy at support and sell at resistance.
Not all stocks have rallied during this earnings season. One of the priorities for President Trump is infrastructure spending, so beneficiaries like U.S. Steel stock, symbol X, went parabolic.
The new administration tried to repeal and replace Obamacare late March but failed (it recently passed Congress, but now the Senate has to amend and approve and that will take time). Despite Republicans controlling the Presidency, Congress and the Senate, investors realized the President’s economic agenda would be hard to pass, and investors have lowered their expectations for the economy and markets. X reflects to this new reality.

Let’s review the chart:
The change in economic direction by China caused many commodity and infrastructure stocks like X to go into bear markets. Once the stock found a bottom and based, the stock went from around $7 to $41 in about a year’s time.
After the election, stocks like X went parabolic with a big gap opening. When stocks go parabolic, the price momentum is hard to sustain. Once the parabolic trendline is breached it could cause a sell signal especially if there was not a fundamental case for the new valuation.
The stock had some profit taking after the trendline breach. President Trump approved the Keystone pipeline and he said he wanted to make sure that the pipeline would be made from U.S. made steel. X rallied again. It was later determined that the steel purchase was already contracted and it was not X because they do not make the type of steel that is needed for the pipeline. Again, profit taking and selling followed.
X has lost almost all of its gains since the election, and also closed the gap (circle on the right side of the chart) and the bearish island reversal pattern (rectangle area).
Investors have shifted from focusing on beneficiaries of the Trump economic agenda to growth.
The NASDAQ is heavily weighted toward tech stocks where the growth is. Below is a chart of the NASDAQ 100:

Around 17 years ago, the NASDAQ hit an all-time high and it’s taken since then to break above that high. Once prices broke, a lot of the supply, sellers were out of the way and it created a buy signal. Once you break above the major long-term resistance and the buy signal is created, it is easy for prices to make continuous highs.
It started to consolidate like the other indexes, but the earnings season has caused this index to break out to new highs. Again it’s easy to continue to make new highs once a new high is established.
The market has shifted to stocks that have price and earnings momentum from the economic agenda of the new administration.
If you’re a trader, momentum player or trend follower you can try and trade these markets. For value investors, this market is tougher.
Value investors must be disciplined and patient. We don’t want to be investing at these high valuation levels because the downside is so high (think of X, buying during the euphoria of the elections and now losing it all). It’s like playing hot potato, you don’t want to be holding a hot potato this late in the game/cycle. This late in the cycle any positions should be considered on a short-term basis, and take your profits when you have them. Once we have a good pullback, bear market, recession, then investing can be long-term.
Summary
- Valuations are high
- There are participants in the market that don’t care about valuations, and they are keeping the markets elevated – at this point.
- There has been a rotation out of the beneficiaries of the economic agenda of President Trump, to growth. The parabolic move of some of the beneficiaries have reversed.
- The good news of stronger earnings this year is already priced into stock prices.
- The sell in May and go away strategy may work this year
- Value investors need to be patient and disciplined. Any new positions invested in this late in the cycle may be considered on a short-term basis. If you have a profit, take it. Once valuations and dividend yields are better, then investing can be longer term.
I will get back to my Trumponomic research reports later this month.