During the presidential campaign, President Trump announced his growth rate goal for the economy was 4% to 6%. Unfortunately there are long-term economic trends that will make this goal of above 3% sustained growth very difficult for any President.
Several years ago I issued a Special Report on the “New Normal”. I update that report to remind investors the headwinds that face this economy and the new administration. Below is an update of the “New Normal”.
This economic cycle has seen subpar growth with little wage growth, and fewer high paying jobs. Is this the “new normal”?
Before the global financial crisis of 2008, Dr. Mohamed El-Eraian (former CEO, and co-CIO of Pimco, one of the world’s largest bond money managers), wrote a book, When Markets Collide. The book received quite a bit of buzz when it came out. One of the main tenets of the book is that the U.S. will face a “new normal” of slower economic growth.
So far Dr. El Eraian has been correct, in terms of a slower growth U.S. economy. Some of the reasons predicted that would cause the “new normal” have been wrong. But many economists and analysts agree, and that the book explains, that the biggest reason for the slowdown is – too much debt from households, businesses, sovereign entities including national, state and local governments.
Ray Dalio, one of the most successful hedge fund managers in the world, produced a YouTube video on how the economy works. The video is more about how leverage, debt has played an important role in the growth of the U.S. economy. He explains that debt is a two edged sword, good during periods of expansion and bad during recessions. The video also explains that there are economic super cycles where the debt piles up that eventually leads to a major economic debt crisis. Click here to view the video.
This economic cycle started in 2009, and it’s in its mature stage of an economic cycle. Like anything in nature, as something ages, it slows down and eventually declines. Below is a chart that shows the length of economic cycles going back to 1950:
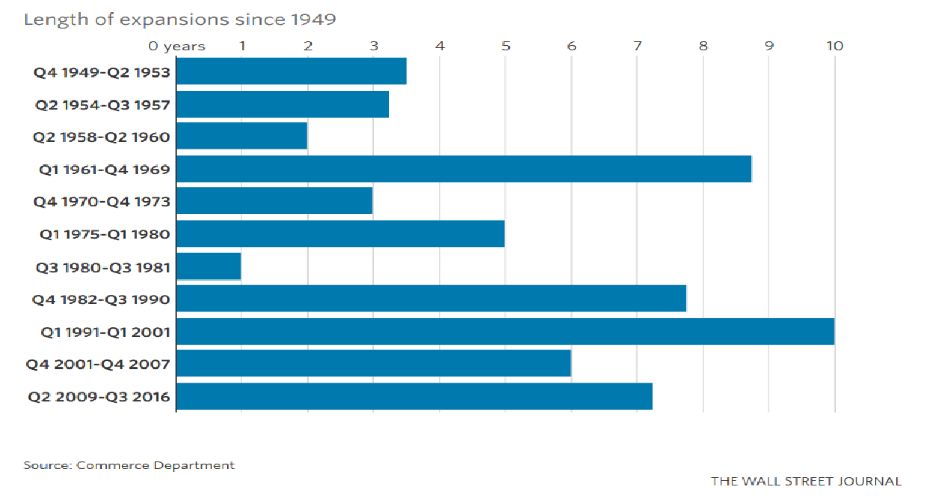
Most economic cycles last about 4 to 6 years.
The 1960s economy was much smaller. In 1960, the economy was about $540 billion. By the end of the decade the economy almost doubled to about $1 trillion. The economy was benefiting from family formations, an electronics boom, and spending on the military and war, otherwise known as “guns and butter”. By 1970s “guns and butter” and the Arab oil embargo that started in 1973 led to stagflation (high inflation and stagnant economic growth).
The longest expansion occurred in the 1990s thanks to the technology, digital boom, relatively low oil prices and inflation,
It Was a Very Good Year, by Martin Fridson, explained the conditions that create the best markets and economies. One of the conditions is a major innovation that creates products and services that the world needs, and these services, products creates jobs, and prosperity. Examples include, autos, air travel, electronics, and the digital revolution. You had major industries emerge in the 1960s, and 1990s. We
don’t have this in the 2000s.
Many economic cycles end because of rising inflation (also includes rising oil prices), the Federal Reserve raises rates to slow the economy and inflationary pressures. What normally happens then is the economy slows and the sins of the cycle are revealed (normally bad allocation of capital into internet stocks, real estate, overseas investing….), then the economy enters a recession.
This cycle is lasting longer than most because the economy is growing at a slower pace. The Fed has kept liquidity high with quantitative easing, and keeping interest rates very low, this has also allowed the economy to expand.
I’ve been following the “new normal” story since the book came out, and I’ve identified other reasons for the slowdown in the U.S. economy, the “new normal”. Below are the most important reasons for the “new normal”:
- Too much debt - consumers, government, businesses are going through balance sheet repair, reducing debts (see Dalio YouTube video).
- Law of large numbers
- Globalization and a more competitive global economy
- Baby Boomers getting ready to retire and spending less
- Younger Americans are changing economic and social trends: sharing services (starting with Napster, Uber, Airbnb, bitcoin…), getting married, starting families or buying homes less than previous generations
- Slow wage growth
- Overly cautious corporations, financial engineering versus capital spending and hiring
- Consolidation of most industries
- Technology and the loss of jobs
Of course there are other reasons for the “new normal”: high corporate taxes (effective tax rates are much lower), regulations (especially in financial services - getting a mortgage, small business loans are more difficult to get due to Dodd Frank), cost of living keeps rising leaving the poor and middle class behind, high college education costs, dysfunction in Washington D.C., decaying U.S. infrastructure (roads, bridges, airports….).
I was going to analyze the slow growth in bank and mortgage lending, but loan demand is down (many sectors of economy are focused on reducing debt). Also alternative sources of capital are available and growing (peer to peer lending, source funding, capital markets, private equity, venture capital….).
Bottom line, we face a very different economy than previous generations.
Law of Large Numbers
Above I wrote about the long economic cycle of the 1960s. As mentioned the economy was much smaller and so it was easier to have better growth numbers with a small base. The economy is now about $18 trillion and can’t grow like it did in the 1960s. I don’t see our economy doubling from $18 trillion to $36 trillion in 10 years.
We can see the law of large numbers working in our largest public companies. Many of our larger companies are no longer growth companies but slower growing, mature companies.
Below is a 10-year history of the revenue for Walmart, symbol WMT:
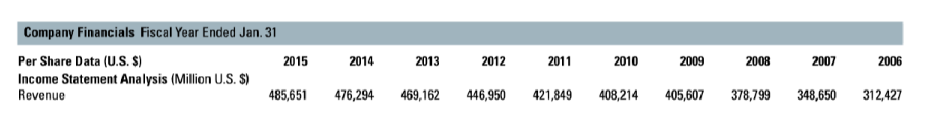
Source: S & P Stock Report for WMT
In the 1970s and 1980s WMT was a high growth company, but now it’s a mature, dividend paying slow growth company.
The average growth rate over the 10-year period is about 5%, but in 2015 revenue grew only 2%. As WMT grows larger, growth slows.
Below is the 10-year revenue history for Exxon Mobil:

XOM and many energy companies’ fortunes depends on oil prices. We can see that XOM’s revenues peaked in 2011 matching WMT’s current revenue.
XOM’s 2014 revenue are essentially the same as ten years ago, when adjusted to inflation.
Below is the 10-year revenue history for General Electric:

GE’s revenue is actually less (when adjusted) to inflation than ten years ago.
If you look at most companies that are over $100 billion in revenue, you see growth slows or is stagnant.

The grey highlighted area are periods of recession; fortunately they are few. The average U.S. recession lasts about 10 months.
Notice that as time goes on, the growth rate slows.
Below is a table that shows U.S. GDP at the start of each decade, and 2015:

From 1970 to 1980 the economy grew about 170%.
From 2000 to 2010 the economy slowed to about 48% for the decade.
We can’t expect the economy to grow above 3% on a sustainable basis when we have an $18 trillion economy.
We are starting to see China slow from 10% to below 7% now that its economy is around $11 trillion. We can also expect China’s growth to slow going forward because of the law of large numbers.
The Financial Crisis of 2008 and Impact on Baby Boomers and Millennials
The financial crisis of 2008 that led to the Great Recession created many hardships and destroyed the confidence of many Americans especially among Baby Boomers and Millennials.
The U.S. economy is about 70% consumer driven. The lack of confidence and high debt levels has caused weak demand from these important groups and is another reason for the subpar growth of the U.S. economy.
Baby Boomers
Baby Boomers are individuals who were born from around 1946 to 1964. There were around 76 million births during this period. This group is a significant component of our economy.
Baby Boomers were responsible for many social, economic and investment trends, and they will probably continue to do so.
Baby boomers have been hit especially hard. Their homes and 401ks and retirement accounts have declined and they’re insecure about their jobs and the job market. They have changed their spending habits.
Baby Boomers are also starting to retire and will start applying for Social Security and Medicare.
Politicians often complain about entitlements, they will only increase as Baby Boomers retire en masse.
Americans, especially women, are living longer, so the growth in “entitlement” spending could increase and last for many years.
A problem for retired baby boomers (and many retirees) is historically low interest rates. Below is a long- term chart for the 10-Year Treasury:

I started my investment career as a stock broker for Merrill Lynch in 1980. I mostly sold income producing investments because interest rates were so high. I tried to get my clients to buy long-term bonds, to lock in high rates. My pitch then was “I hope when I retire that rates are double digits.” I had no idea rates would go as low as they are now.
Investors locking in double digit rates did well.
Below is a chart that shows the net worth of an individuals over the last few decades:
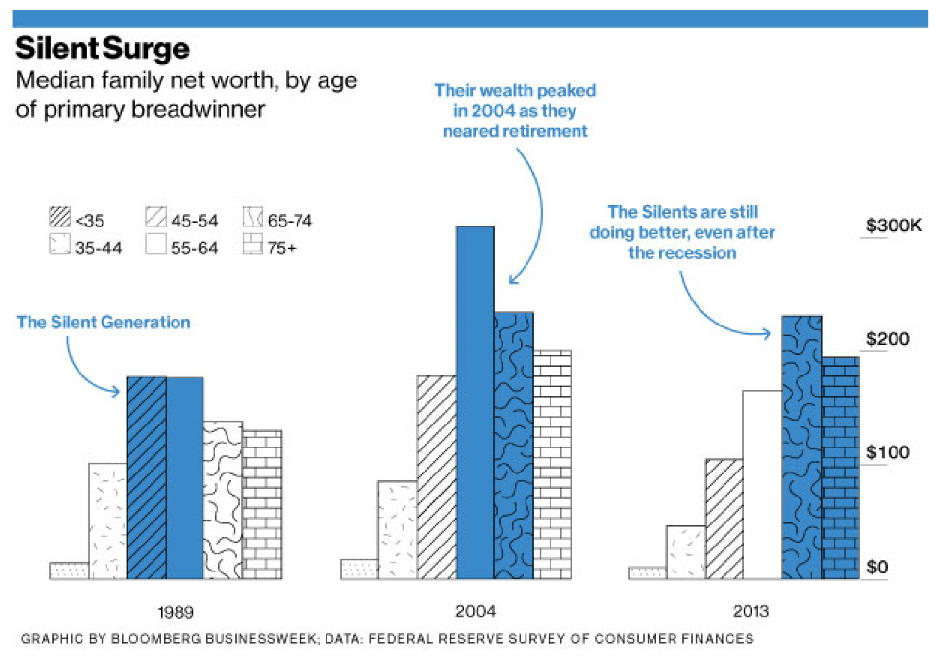
If an investor invested $200,000 in a 10-Year Treasury at the prevailing rate of about 12% during the early 1980s, the income generated was about $24,000 in income. Back then $24,000 could go a lot further than today. I was able to help a lot of my clients invest in safe double digit income producing investments in the early 1980s.
Today if a retiree invested the majority of their nest egg, about $200,000 (average net worth of a retiree) into a 10-Year Treasury at 2.5%, they would only generate about $5,000 in income. Also, the cost of living is much higher today, especially for health care.
Today’s retirees have less to spend from their portfolios, leading to less aggregate demand from retirees in the U.S. economy.
Millennials
Millennials, also known as Generation Y. They number approximately 80 million (close to baby boomer numbers), and were born from the early 1980s to the early 2000s.
Millennials are also creating many social, economic and investment trends.
They faced many economic headwinds during this difficult economic cycle: high post high school education and training costs and debts, poor job markets where many are underemployed, working part-time or remain unemployed, and the high cost of living.
This generation started and made many technologies popular that are free or where goods and services are shared or rented. The first such popular service was Napster, a free file sharing service that was mostly used by users to download free music. Millennials have also invented and made popular services like bitcoin, Uber, Airbnb, Netflix, Hulu, and crowdsourcing.
Car buying, marriage, family formations, and home buying trends have changed and are less from previous generations.
Could these economic, demand trends change? Hopefully!
The Global Economy Is More Competitive and Has More Participants
Post WWII, the U.S. was the economic engine of the world, but this is changing.
The Berlin Wall, and the fall of communism in the late 1980s, early 1990s caused more competition in the global economy including China, Russia, and Eastern Europe. Latin America, especially Brazil and Mexico also became more competitive after the 1990s.
The dominant, developed economies (Europe, U.S., Japan) are all slowing due to the size of their economies, large debt levels, aging populations, high costs, bureaucratic economies with more regulations and complacency.
Emerging economies in Latin America, South East Asia including China are the opposite: they have younger populations, they’re hungrier, they have less regulations, lower costs, and less net debt.
The U.S. now operates in a more competitive global economy and this leads to outsourcing and the consolidation of industries, fewer high paying jobs, and stagnant wages.
Here is a freeway analogy: consider the 1960s U.S. economy as a car in the fast lane with few other cars on the road, global competition. The U.S. was the dominant economy in the world for decades.

Today our economy is so much bigger and is now like a big rig with far more traffic (more global competition).

We’re not the economy of 30 to 60 years ago.
Outsourcing
U.S. companies have been very good at expanding internationally to grow their businesses. It does not make sense for Coca Cola, or General Motors to make a can of coke or cars in the U.S. and ship to their customers overseas. Those jobs need to be close to their customers.
Some jobs do go overseas because of lower costs and regulations. Below is a chart that shows the labor costs per hour for shoe manufacturing:

The average hourly wage of an American worker is about $21 (wages and benefits). If you were to locate a shoe factory, where would you locate it? Would it be the U.S.?
Creating tariffs to make our goods and labor more competitive could have many unintended consequences: higher inflation and interest rates, retaliation from our trading partners, and the potential for a global recession.
New Technology, Innovation
Technology has improved the lives of many in the world, and has made the workplace and workers much more productive. The downside of technology is that it has eliminated millions of jobs.
In the 1990s, I read an article that the vision of many technology companies was to help companies and governments across the globe automate tasks and jobs to make them more productive. Technology companies have been very successful at their goals. Again, the downside is many jobs were eliminated.
There are many jobs that have been reduced because of technology: bank tellers, gas station attendants, checkout clerks at grocery stores, telephone land line workers, travel agents, workers at record and book stores, print newspaper employees….
Consolidation of Many Industries, and Downsizing among Many Companies and Industries
I go to many investment conferences, and seminars where I meet young graduates looking to start their investment careers. They ask me with urgency if I know of any jobs or internships. I began to realize how here was much more opportunity and growth in the economy when I graduated from graduate business school. My generation did have it better with more companies to interview with, stronger economic growth, and a lower cost of living (including college expenses).
The consolidation of many industries, and the downsizing of companies have laid off millions of workers, and there is less opportunity for younger workers. There is very little discussion from economists, and President Trump of this major trend that started many years ago. This trend is and will be an obstacle for job creation and better economic growth.
As a shareholder of some of some of these companies, gaining scale, entering new markets and offerings through mergers and acquisitions have lowered costs and increased revenue and is good for the bottom line and stock prices, but is has been bad for the millions of workers that have been laid off, and for new workers trying to start their careers.
When I graduated from business school I interviewed with Goldman Sachs, Merrill Lynch, Kidder Peabody, Smith Barney, and Chemical Bank. I had three job offers early on, so I quit looking. Notice the list, only one company is independent, Goldman Sachs. The rest were swallowed up by bigger companies and basically don’t exist anymore. I know that if I graduated today, I would not have the same opportunities that graduates had 30 years ago.
Our generation has been impacted by these consolidations, mergers and acquisitions. I’ve lost several jobs due to mergers and downsizing.
I’m sure if you think about it, how many companies have you’ve worked for still exist, and how many times have you’ve been laid off because of downsizing and mergers?
No matter what industry graduates are looking to start a career, the options they have are fewer than my generation. Below is a list of a few industries and the consolidation they have gone through:
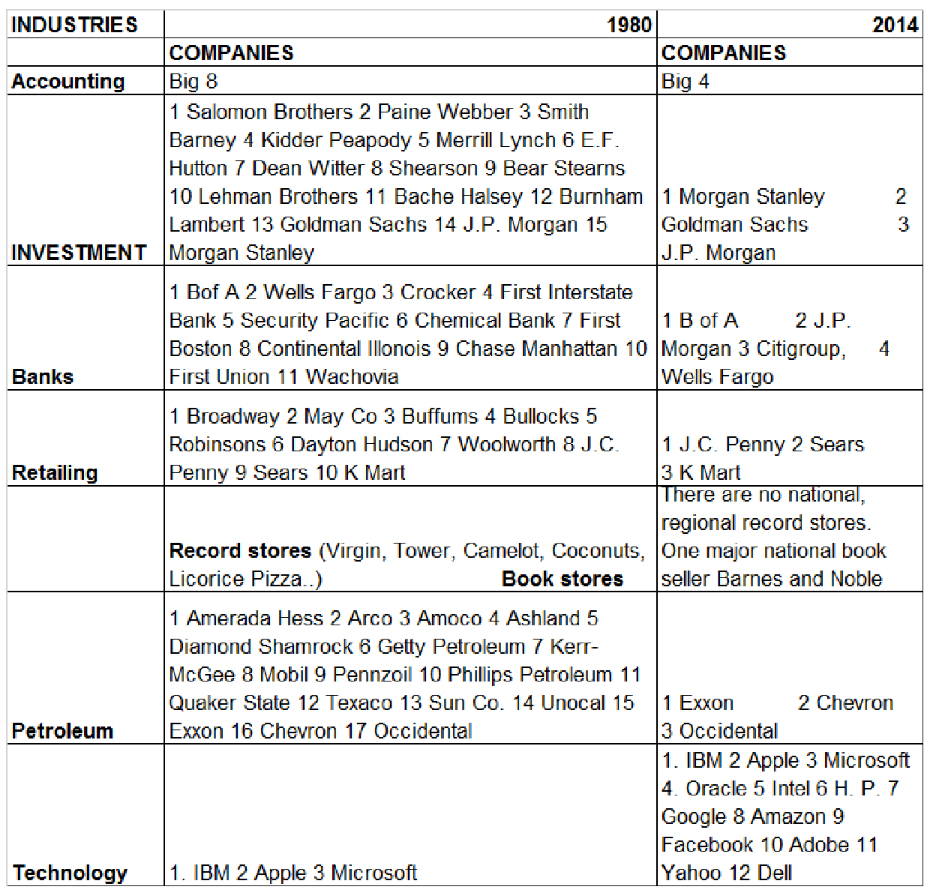
This list is a sample of the many companies that existed over 30 years ago, and a sample of the few large companies that remain today.
The lists of companies above are important because most of these companies were where graduates go to start their careers, receive valuable expensive training, a good starting income, and experience.
Visually one can see that in 1980 there were many more companies that existed compared to today, and our economy is much bigger and has a much larger work force.
When companies consolidate, or in the case of sectors like record and book stores, many high paying jobs were lost in accounting, marketing, management, finance that will not come back. Not all companies were acquired or merged; some went bankrupt or are out of business: E.F. Hutton, Burnham Lambert, Lehman Brothers, Woolworth, and Continental Illinois.
Also, many of these industries have many companies in them, but many of these industries are dominated by a handful of huge international companies. For example banks, there are thousands of banks, but the major banks listed above hold most of the deposits and make most of the loans.
Notice that technology is an area in the economy that has expanded and provides high paying jobs, but not all graduates studied information technology, software engineering…
Graduates with degrees in information technology, engineering, business or healthcare will probably do better than other graduates.
The questions is - where do young graduates go for their first career job, training and experience?
Cautious Employers and Financial Engineering
As shareholders we’ve benefitted from financial engineering, especially stock buyback programs, and a prudent corporate America, but it has not helped our economy and workers.
At the start of the Great Recession corporations cut capital spending by about 20% and laid off millions of workers. The economy contracted about 8% at the start of the Great Recession, so corporations overreacted.
If we look at the energy industry, it spent about $1 trillion on capital spending during this economic cycle and created a shale energy boom that created lots of wealth and high paying jobs and has made us less dependent on foreign oil.
Most other industries cut capital spending, downsized and increased share buybacks and dividends.
Again, this is good for shareholders but bad for the economy and workers.
Corporate stock buybacks were about $561 billion in 2015 and the final for 2016 is expected to be about $600 billion.
Stagnant and Volatile Pay
The financial media, the Fed, politicians and workers all complain about stagnant wages and the need to put more income into the pockets of lower income and middle class consumers.
Below is a chart that shows the trend in household income:
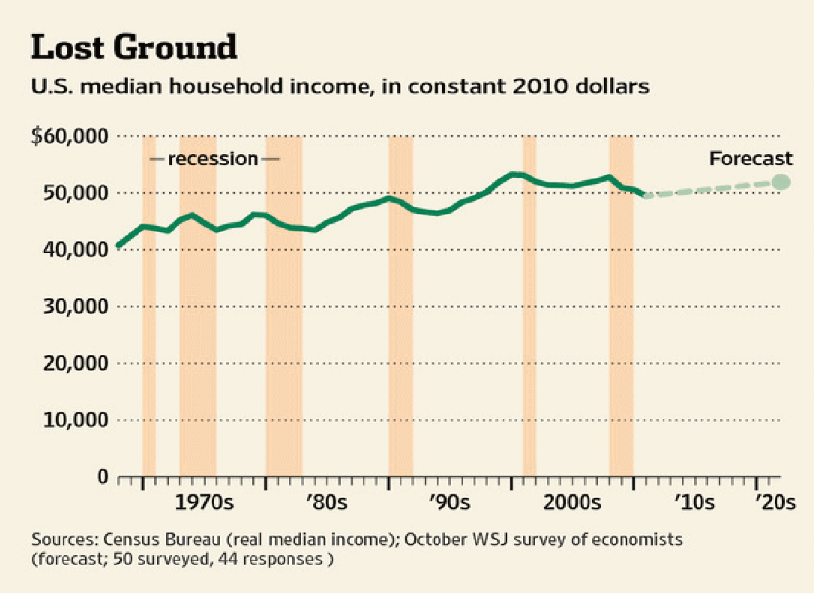
We can see that wages increased about 25% from the 1970s to the later part of the 1980s. Wages are essentially the same today as they were in the late 1980s.
As the chart shows, these numbers are in constant 2010 dollars. I read a study that if you have a family and or are divorced you are being left behind economically. Families are being left behind economically because education, childcare and healthcare costs are growing much faster than wages. If you’re single, you should be in better shape financially.
Some politicians and economists blame cautious employers for the lack of wage growth. In the above section about cautious corporations and financial engineering we can see the chart below does show that wages have dropped as a percentage of national income:

Below is a chart that shows that corporate profits as a percentage of GDP is at historic highs:

Some economists argue that employers have increased spending on employee health care costs and other benefits. Some of these benefits don’t show up in wage costs.
I found another reason in my research on why there is less spending, demand. Entrepreneurs, the self-employed, part-time workers, workers dependent on tips, employees who work on commissions, temporary employees, and workers that have multiple jobs have volatile incomes. Making the situation
worse is they don’t have the savings to get them through times when their incomes fall.
JP Morgan did a study on household savings and household income volatility. Below is a chart that shows the problem: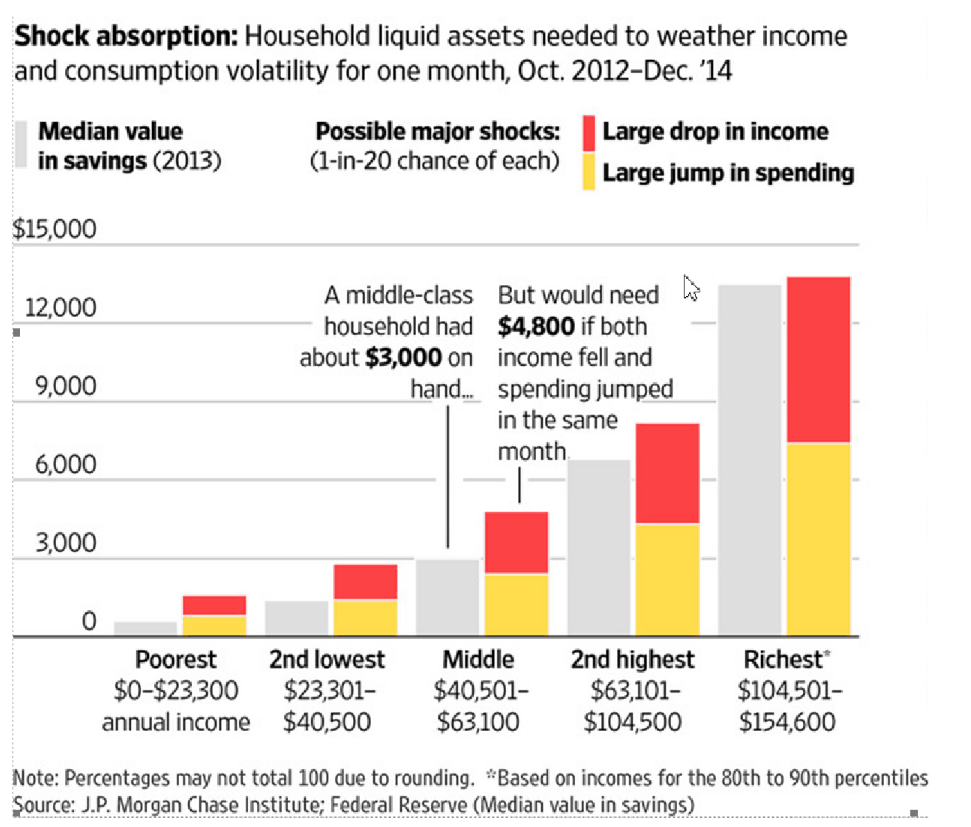
The chart shows that poor to middle income households that have volatile incomes don’t have the savings to get them through periods when their income drops. For example, a middle class household typically has expenses of $4,800 a month, but they only have $3,000 worth of savings. The situation is better for more affluent households.
According to a Federal Reserve study, income volatility impacts about 40% of the workforce.
Unemployment, the Underemployed and Part-Timers
Again, a more competitive global economy, outsourcing, technology, globalization, consolidation of many industries, more cautious companies have all lead to stagnant wages, fewer high paying jobs, more part-time and underemployed workers.
With such a large economy and population and the many economic headwinds the U.S. economy faces, it is hard to move the needle on the economy.
Conclusion
The “new normal” will make it difficult for the current administration to achieve its economic growth and job creation goals.
The new administration, investors, and workers need to realize our economy is very different than previous cycles and generations, and we must adjust to these new realities. The President’s economic policies don’t address the trends listed above.
It is very rare in the late stages of an economic cycle (we are in the 7 th year of this economic cycle, and most economic cycles last 4 to 6 years) that the economy picks up steam. Most economic and market cycles are like a 10K race: in the beginning a runner has more energy, but toward the end the pace slows and most runners don’t have the same energy they had at the beginning of the race, and eventually the race ends.
We could get a boost with the many stimulative economic policies (tax cuts, deregulation, repatriation of overseas corporate profits, infrastructure spending) that the congress and senate will probably pass. But, we don’t know what will be passed and when. Also, it is unusual to have this much stimulus this late in an economic cycle.
As I’ve been writing about for the past year, it is best to stay cautious, patient and disciplined.
My next research report will analyze the President’s economic stimulus programs. They could extend this economic cycle if we don’t wind up in a trade war, military war or some black swan event. I will also update my report on my investment strategy during this uncertain and risky investing period.